Crypto Strategy Discovery: Robust BTC & ETH Research
A research project that hunts for genuinely profitable, non-overfit BTC/ETH strategies. Frozen 30% out-of-sample holdout, walk-forward parameter selection, deflated Sharpe, parameter-neighborhood robustness, realistic frictions. Returns are easy to fabricate; statistical honesty is hard.
In plain English
A trading strategy is a rule for when to buy and sell — for example, “buy Bitcoin when its 50-day average crosses above its 200-day average, sell when it crosses below.” A backtest runs that rule against historical prices to see what the P&L would have been.
The dirty secret: it is trivially easy to invent a backtest that looks profitable but would lose money in real life. You try a hundred different rules, pick the best one, and report it as if you’d discovered it. You don’t include trading fees. You optimize the rule’s parameters on the same data you’re testing it on. Each of these adds a little bit of “lookahead” or “selection” bias, and stacked together they turn random noise into a Sharpe-2 strategy on paper.
This project hunts for real edges in Bitcoin and Ethereum trading by deliberately designing the experiment to fail when no real edge exists. The eight rules below are not technical curiosities — they are the difference between a project that produces honest answers and one that produces wishful thinking. Several of the strategies looked great in early phases and then died on the frozen test split, which is the project working correctly.
Anti-overfitting principles
- Frozen out-of-sample (OOS) holdout. The final ~30% of history is never used for parameter selection or strategy choice. It is touched exactly once, at the end of each phase.
- Walk-forward analysis. Parameters are re-fit on rolling windows; only next-window returns are recorded. No single-point fits.
- Deflated Sharpe Ratio (DSR). Every reported Sharpe is deflated by the number of trials run, following Bailey & López de Prado (2014). A nominal Sharpe of 1.5 across 50 trials is not a discovery.
- Realistic frictions. 10 bps per side (20 bps round-trip) + 5 bps slippage on every trade.
- Parameter robustness. A strategy is only accepted if a neighborhood of parameters works — not a single sweet spot.
- Minimum-trades guard. Strategies with < 30 trades on the test window are rejected for lack of statistical power.
- Concentration check. If > 40% of profit comes from < 5% of trades, the strategy is flagged as fragile.
- Buy-and-hold benchmark. Risk-adjusted outperformance vs. buy-and-hold, not absolute return, is the bar.
Phase progression
| Phase | Focus |
|---|---|
| 1–3 | Trend, mean-reversion, breakout primitives |
| 4 | Candidate selection on validation |
| 6 | Carry / funding-rate signals |
| 7 | On-chain features (active addresses, whale flows) |
| 8 | Meta-ensemble of phase-1–7 survivors |
| 9 | Hybrid strategies blending vol-regime gating with carry/momentum |
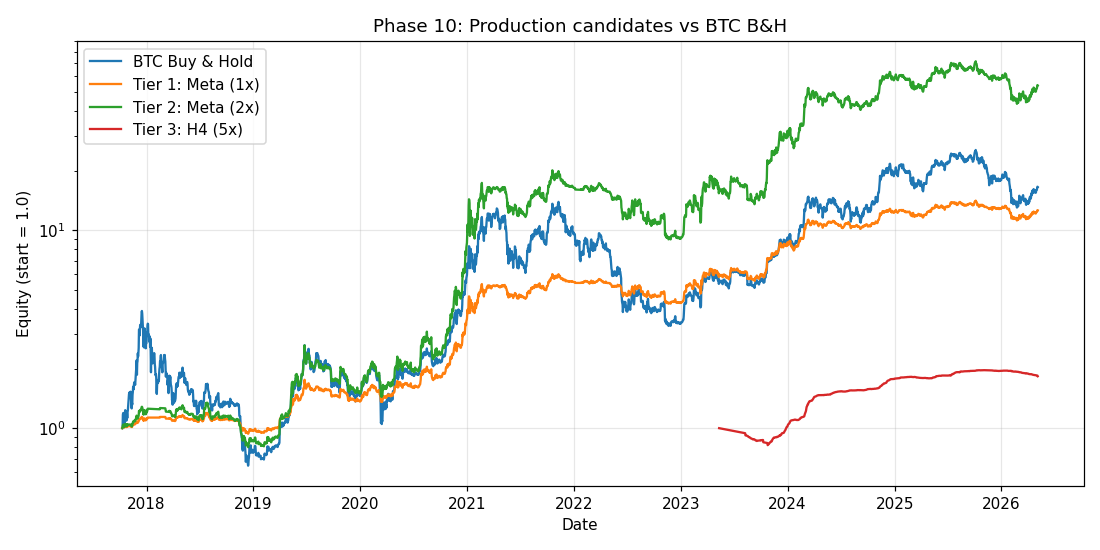
| 10 | Production candidate — final OOS evaluation |
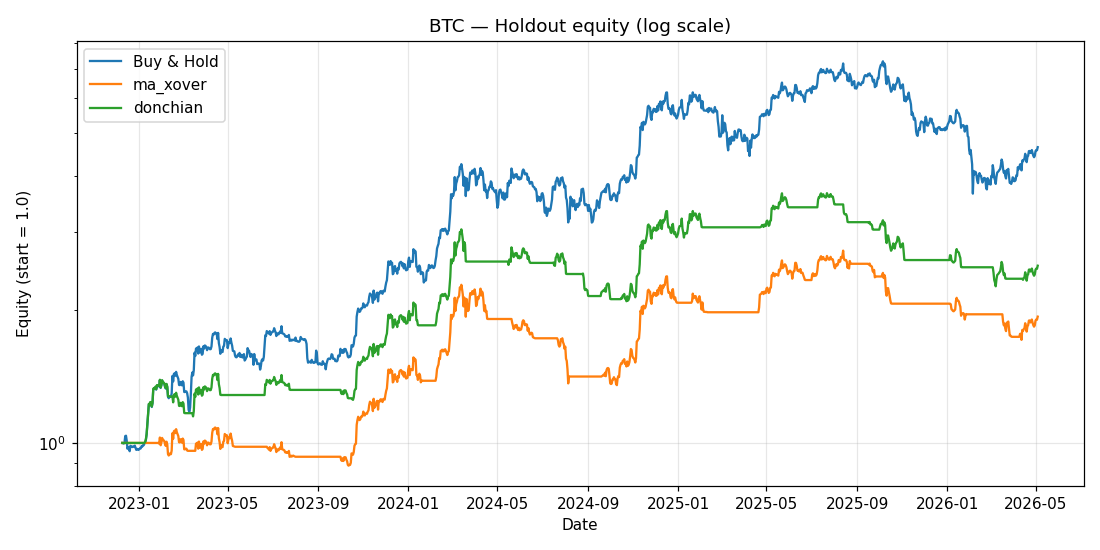
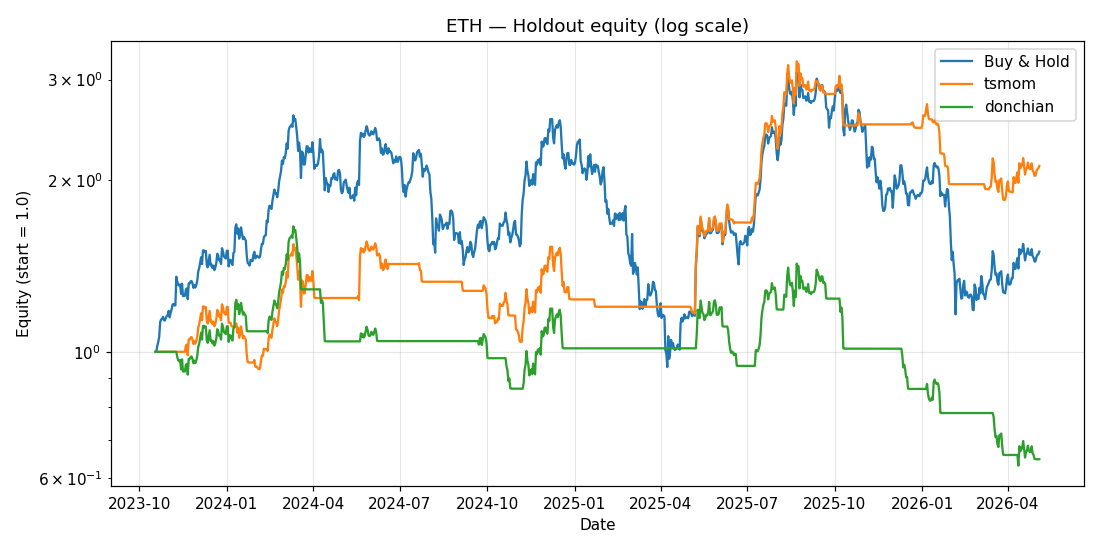
OOS results
What it demonstrates
- Frozen-holdout discipline that catches lookahead bias by design — found and killed multiple “promising” strategies whose edge collapsed on the OOS split
- DSR as a routine reporting metric, not a footnote
- Cross-sectional analysis (BTC vs. ETH) to test whether an “edge” is asset-specific or generalizes
- Honest reports: every phase has a
REPORT.mdwith what survived, what didn’t, and why — including the dead ends
The point of the project isn’t the equity curves. It’s that the equity curves you see survived a process designed to murder them.