LEAP Trading Strategy: Leveraged Long-Dated Options Backtest
A research project on whether systematic LEAP (long-dated deep-ITM call) strategies can beat buy-and-hold on a risk-adjusted basis. Self-funded variants, drawdown stability, drip-DCA sweeps over moneyness × tenor, and a real backtest on historical option chain data.
In plain English
A LEAP (“Long-term Equity AnticiPation”) is a long-dated stock option — typically a call option that expires 1–3 years out. Because options give you leverage, buying LEAPs is a way to get something like 3–5× the upside of a stock for a fraction of the capital. Retail finance Twitter loves them: “Why buy 100 shares of QQQ when you can buy a LEAP and get the same dollar exposure for a quarter of the cost?”
The pitch is correct that LEAPs are leveraged. The pitch is wrong that the leverage is free. Options decay over time even when the stock is flat (theta), they get crushed when volatility drops (vega), and rolling them when they expire costs spread and slippage every cycle. A naive LEAP strategy can underperform just holding the stock over long horizons, and the drawdowns when volatility spikes can be brutal — while the stock is making new highs, your LEAP basket can still be down 60%.
This project asks the question carefully: across many combinations of how-deep-in-the-money, how-long-until-expiry, and how-often-you-rebalance, are there any LEAP strategies that risk-adjust above just buying and holding the underlying? The answer turns out to be qualified — yes, but only in a small allocation inside a mostly-stock portfolio, and at the cost of much larger drawdowns. The all-LEAP and self-funded “infinite money glitch” designs popular online don’t survive an honest backtest.
Designs tested
Designs tested
- Fixed-deposit LEAPs — $1k every 2 weeks into a fixed moneyness/tenor LEAP
- Continuous DCA vs. lump + DCA vs. self-funded (no fresh deposits after year 1)
- Blended portfolios — stock + LEAP, stock + LEAP rolled, stock + LEAP held-to-vertical
- Barbell — small allocation to long-dated LEAPs + larger cash buffer
- Improvements: drawdown-stable variants that exit on volatility regime change
Headline: self-funded one-year-deposit-only ($1k / 2wks for year 1, then ride)
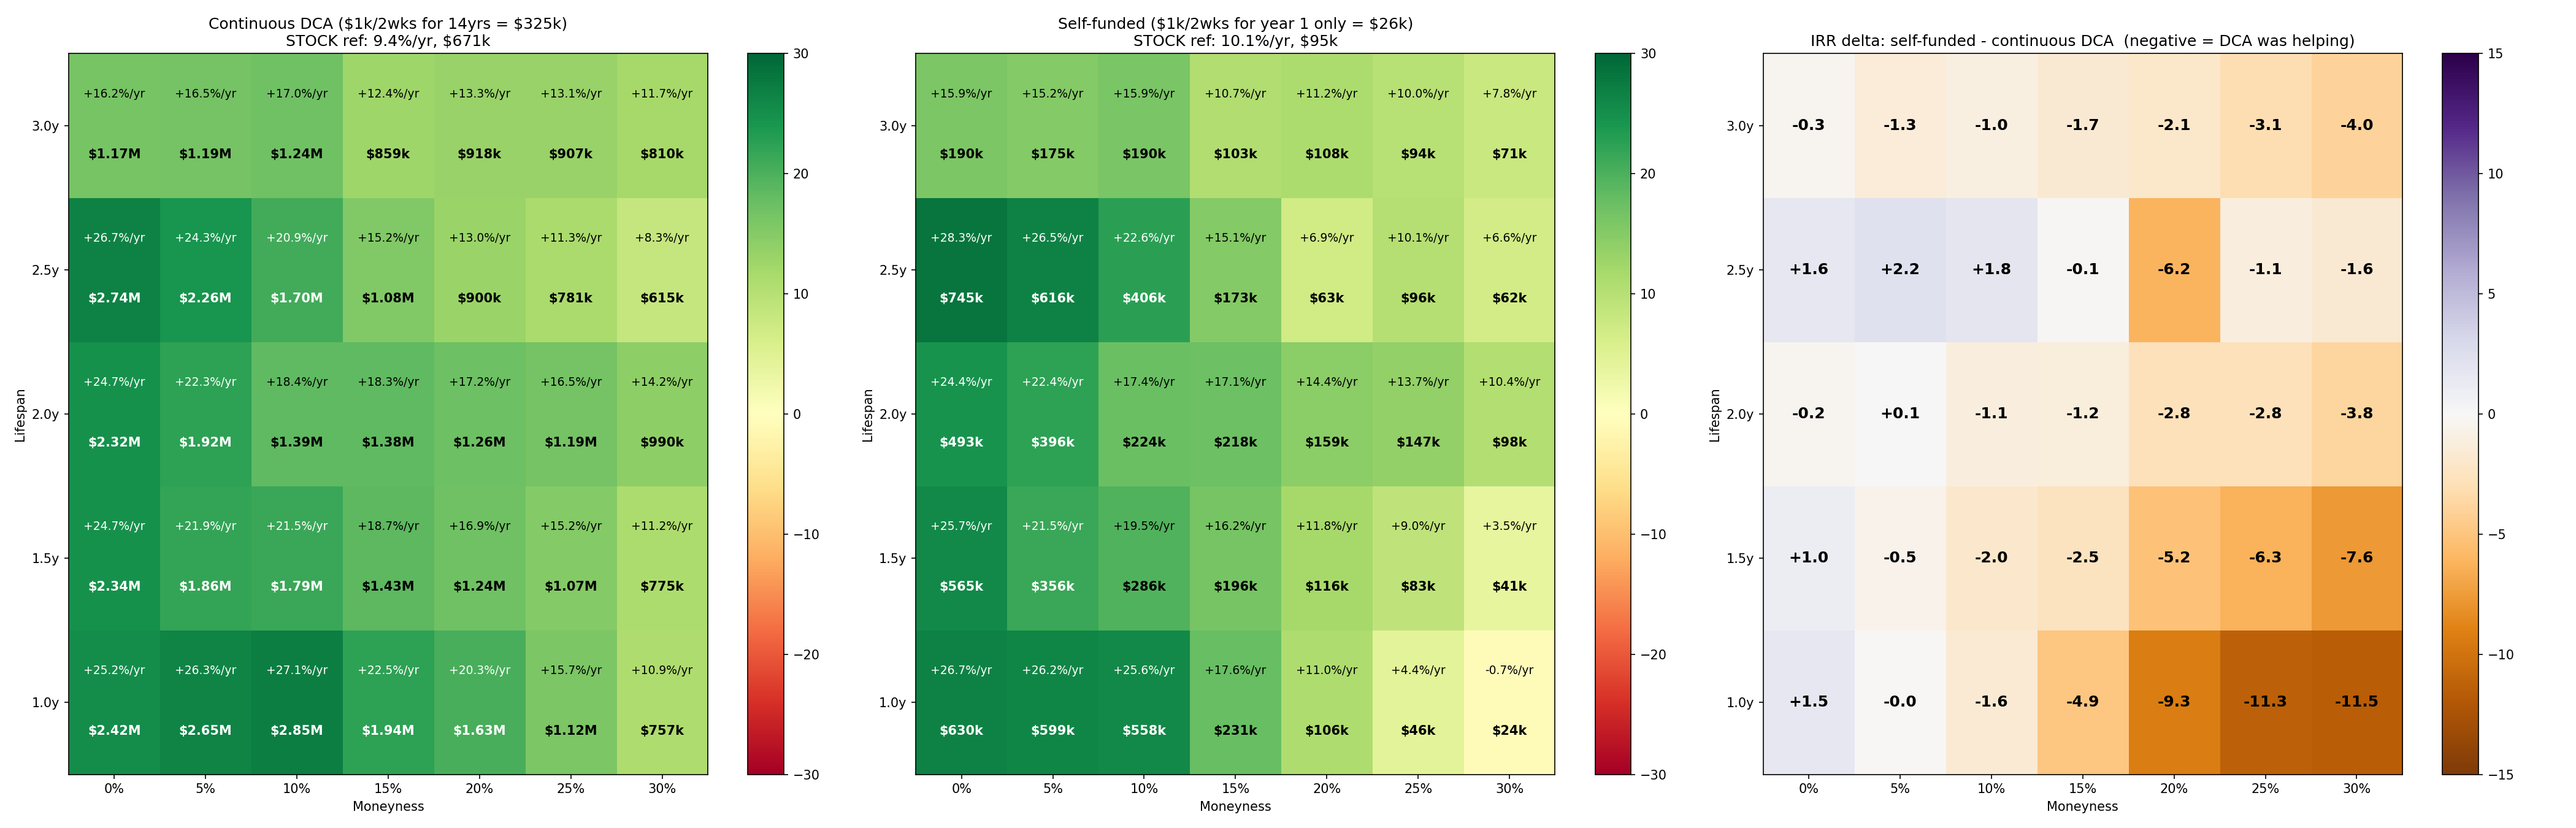
The middle panel is what matters. Self-funded LEAPs underperform stock-only on $/year across most moneyness × tenor cells once you factor in friction. The “wins” are concentrated in deep-OTM long-tenor cells — exactly the cells with the worst path-dependence and the largest drawdowns.
The right panel is the IRR delta vs. continuous DCA. DCA wins in 14 of 21 cells, often by 5–10 percentage points. The intuition is mechanical: continuous DCA averages your cost basis through volatility regimes and sells less of the long-vega exposure into vol crashes.
Drawdown stability
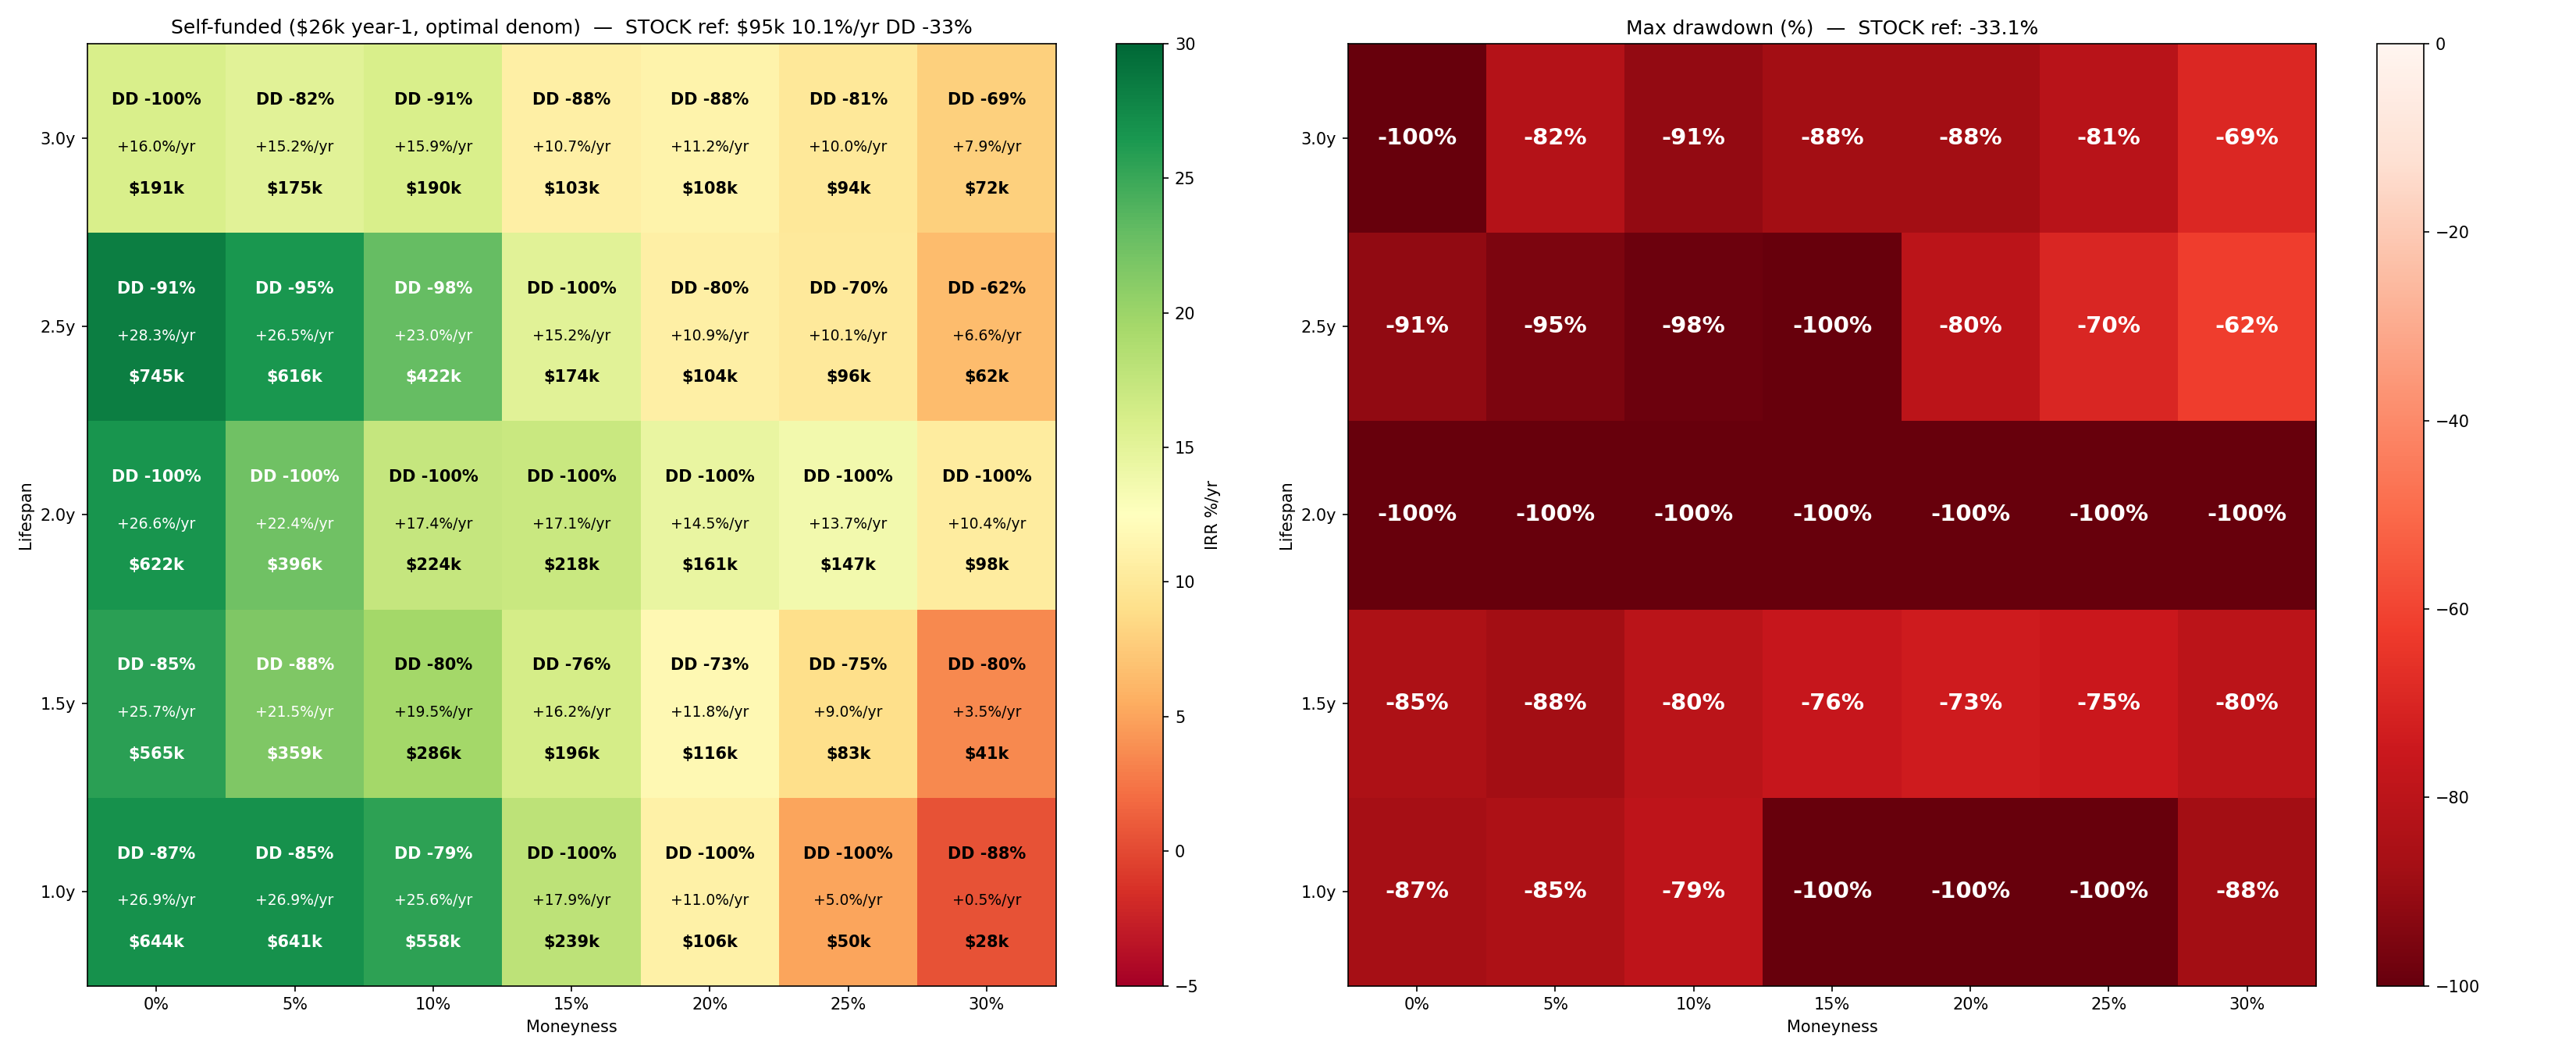
LEAP drawdowns are not just bigger than stock drawdowns — they are differently shaped. Stock drawdowns mean-revert; deep-ITM LEAP drawdowns become permanent capital loss when realized vol crushes during the holding window. The chart shows the period where buy-and-hold is making new highs and the LEAP basket is still down 60%.
Drip-DCA sweep
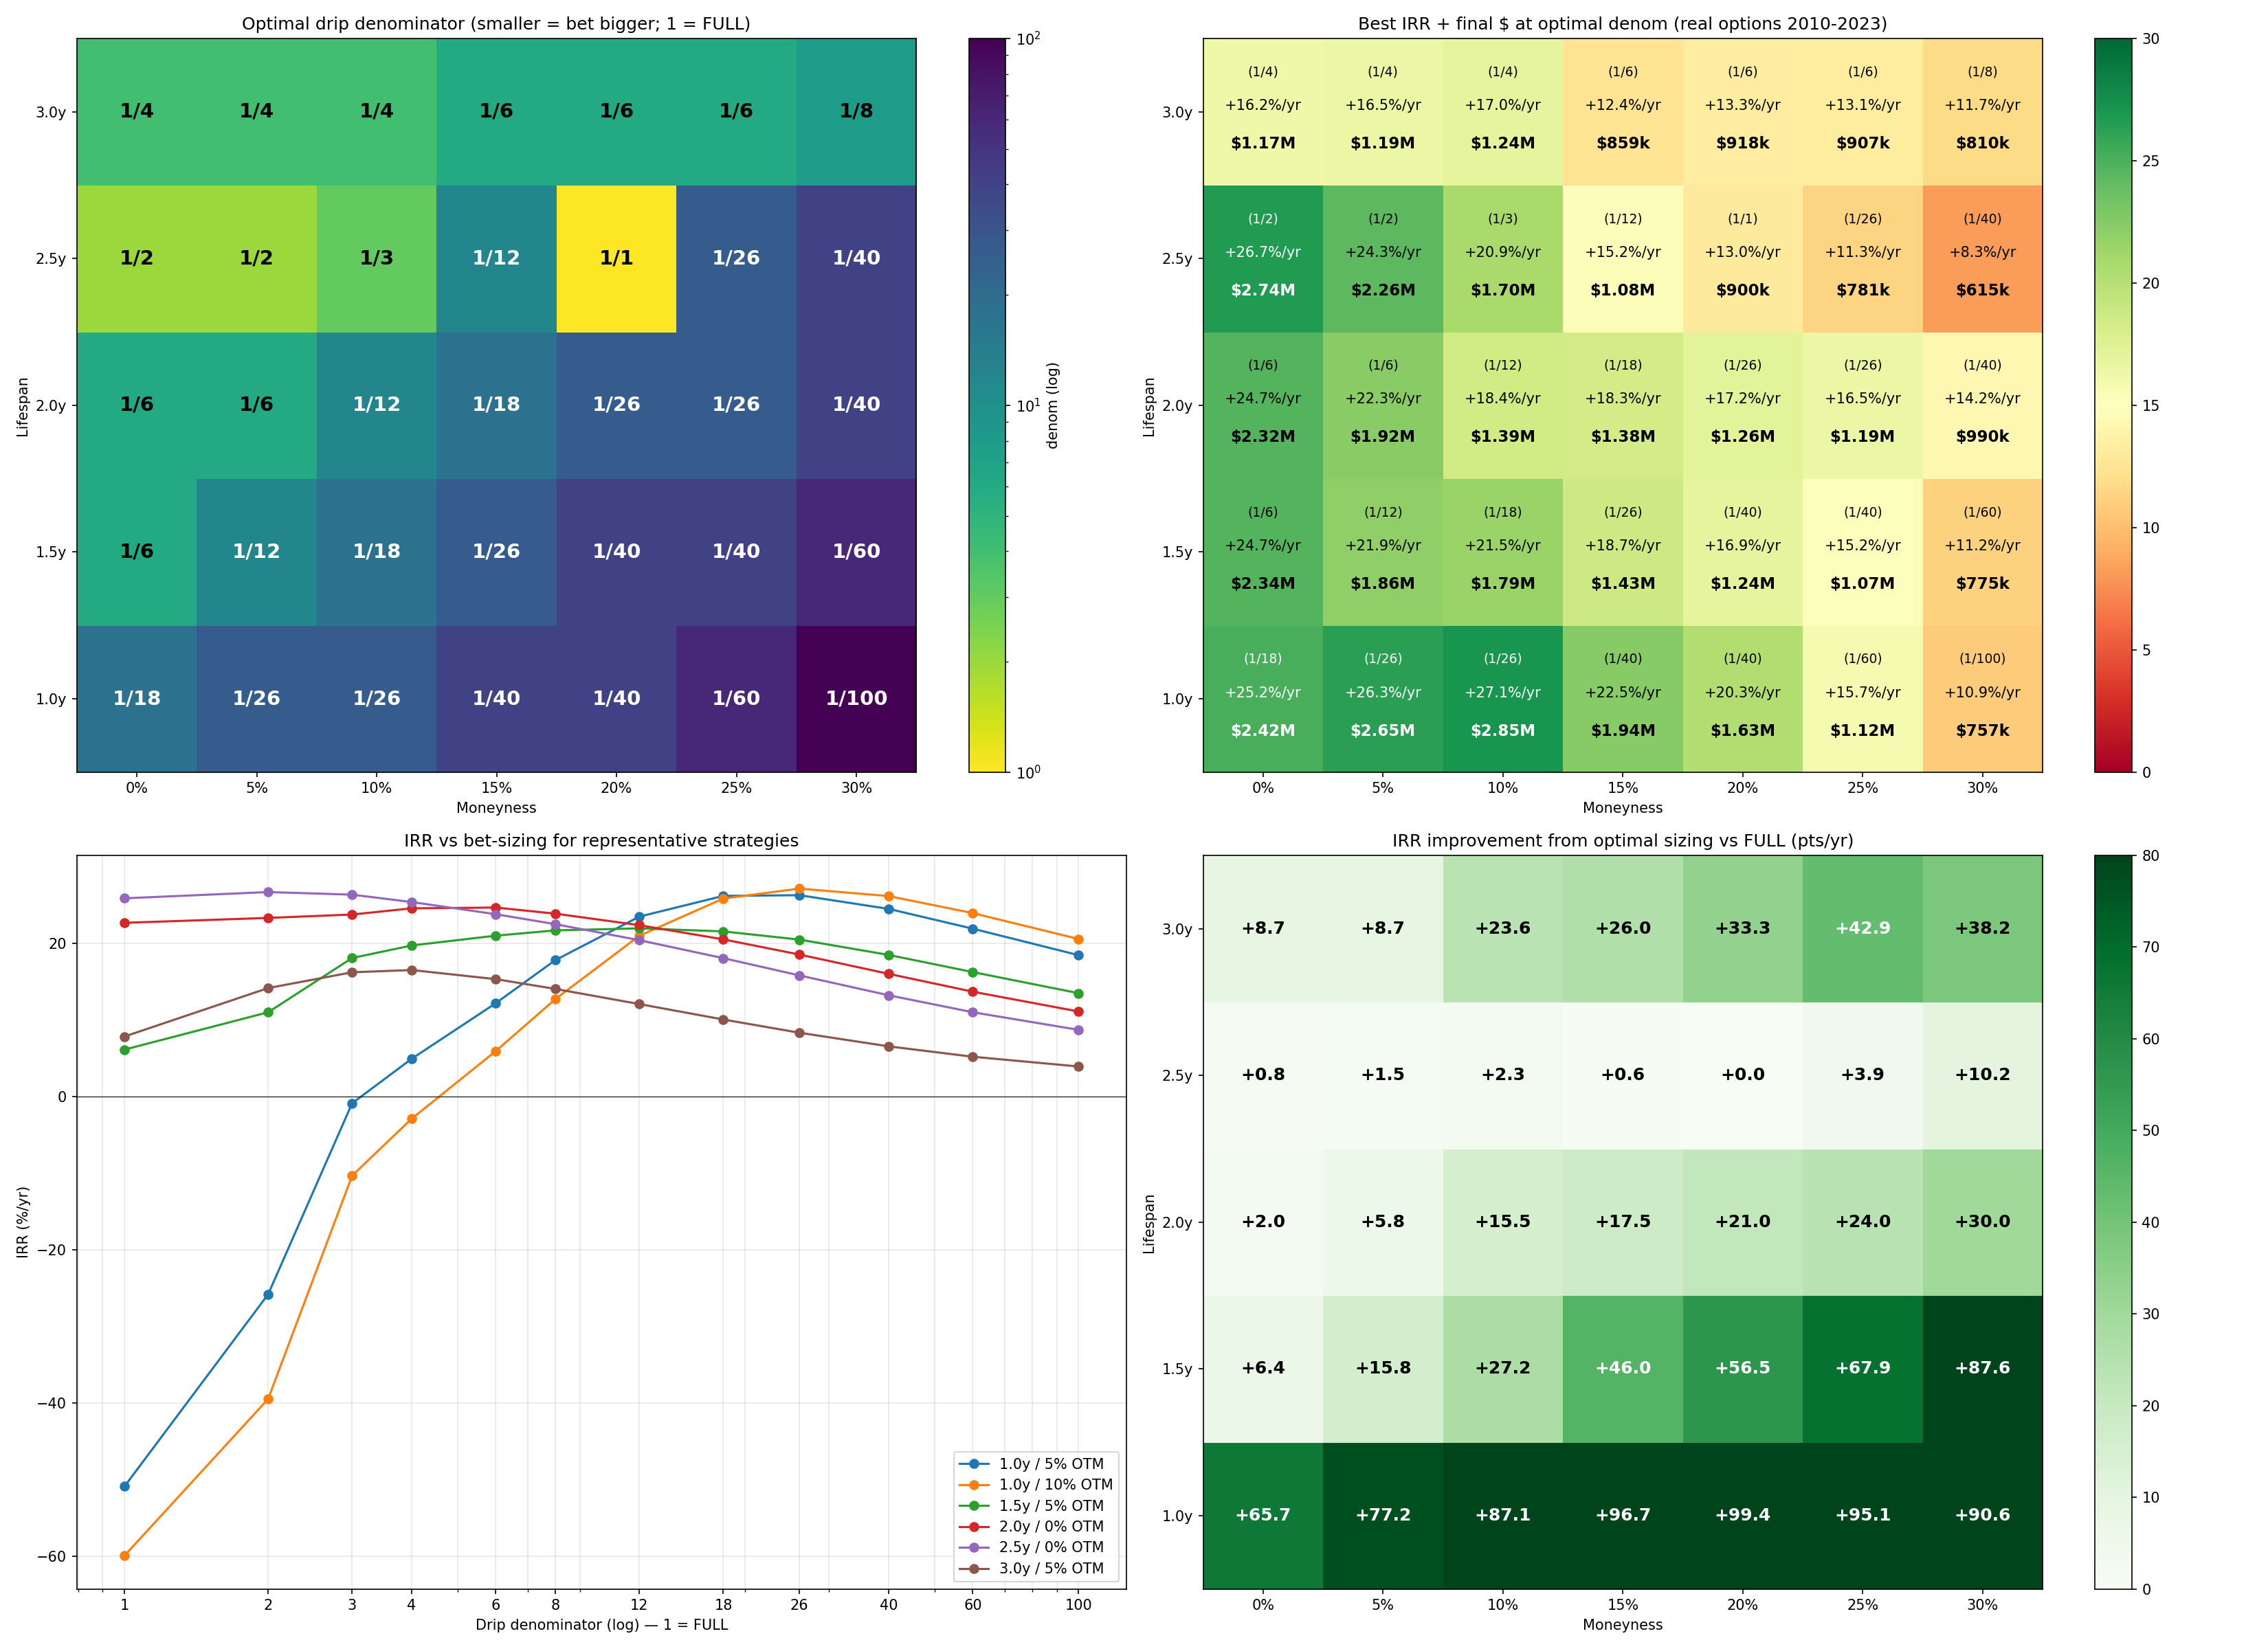
For each (moneyness, tenor) cell I run a parameter sweep on the drip rate. The optimum rate is not a single point — it varies sharply with moneyness, which means a strategy chosen on one moneyness band will not generalize.
Blended portfolio: where the realistic wins are
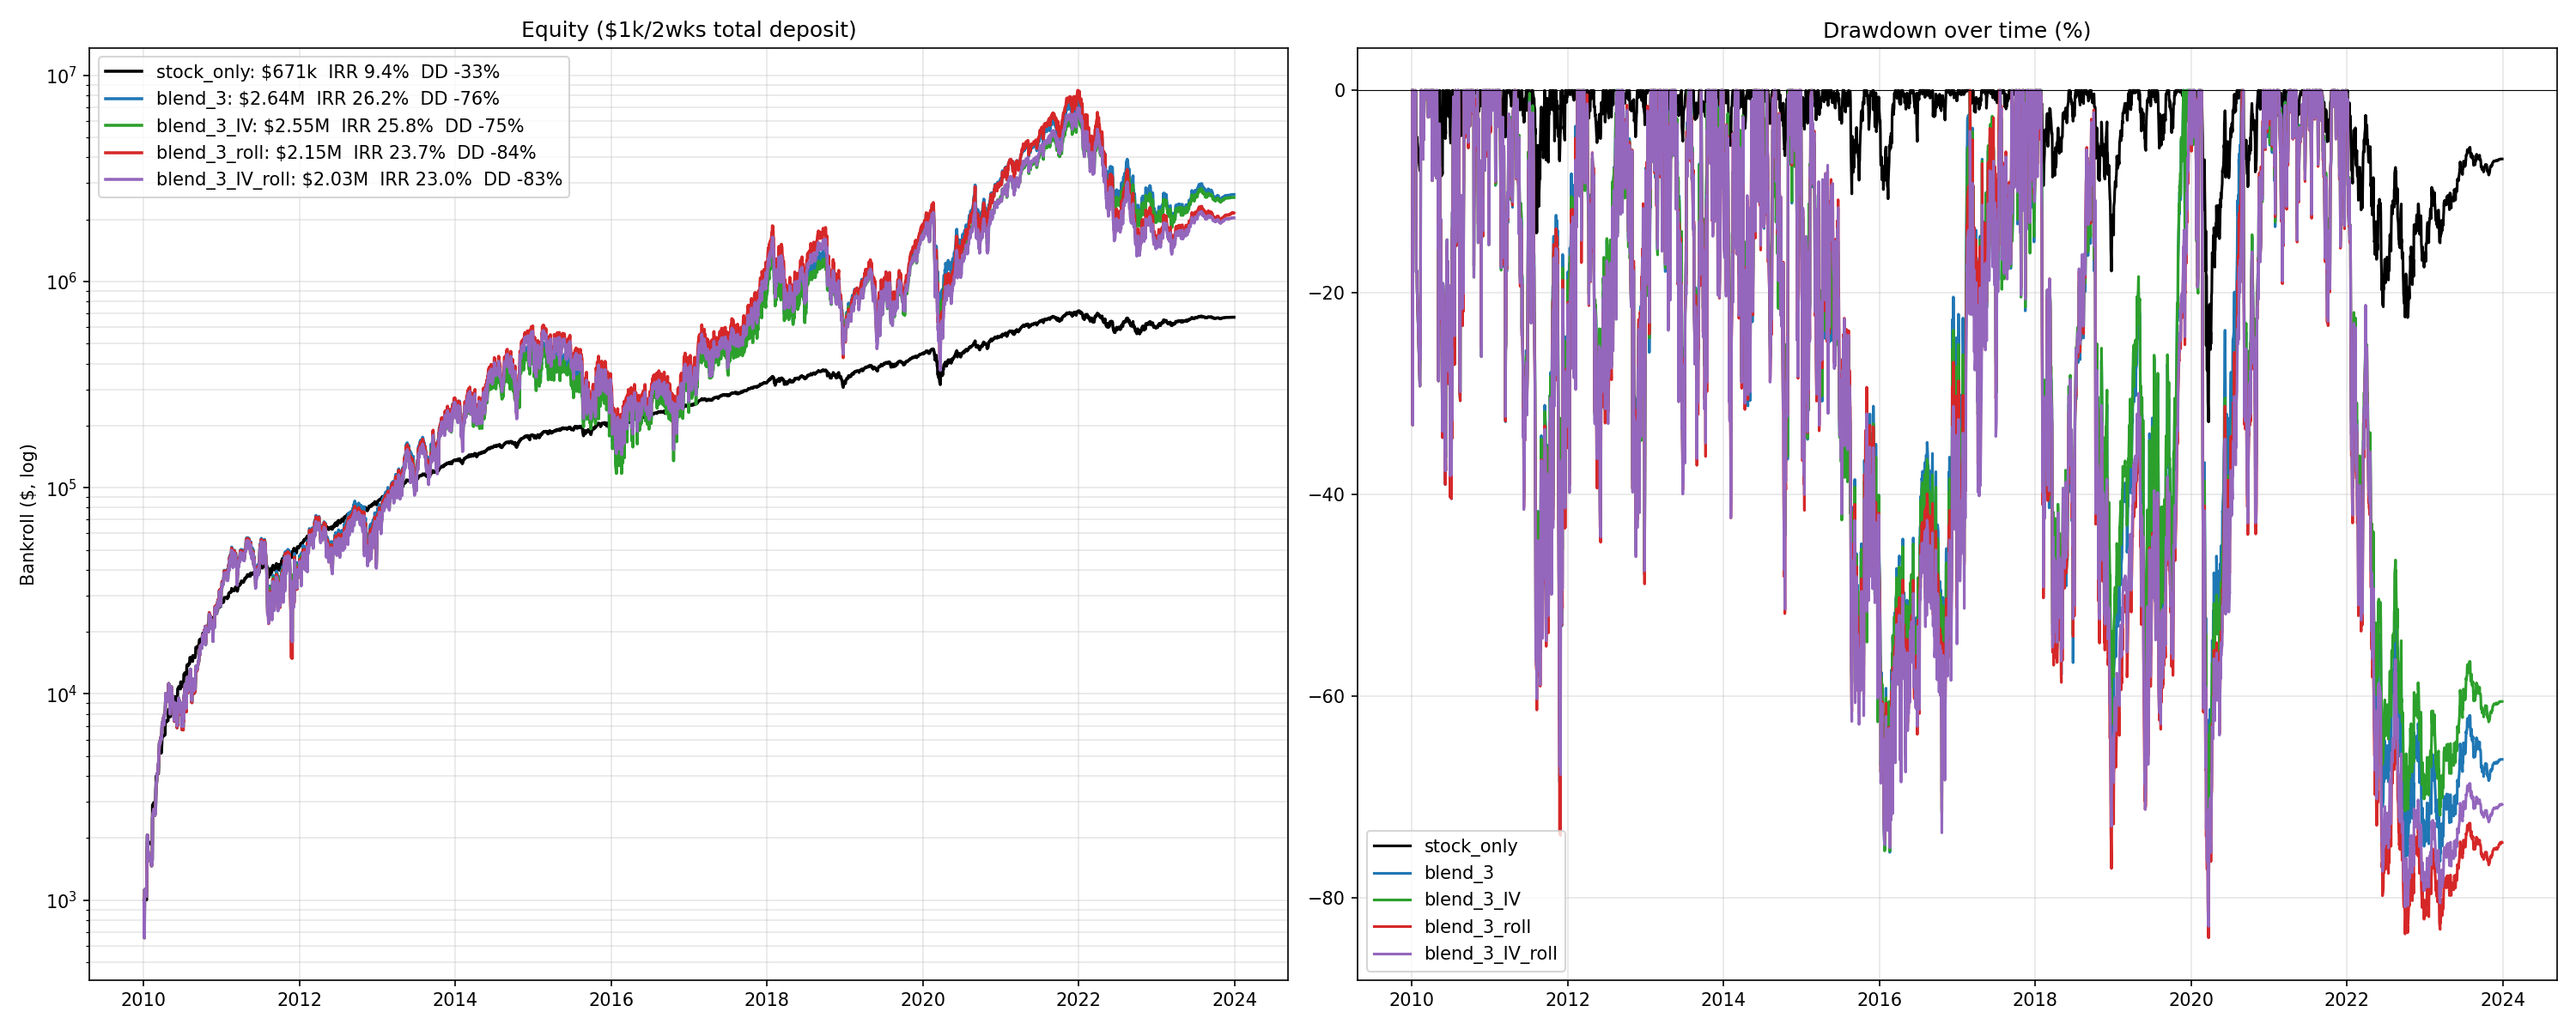
The realistic finding from the project: a small LEAP allocation inside a mostly-stock portfolio risk-adjusts modestly above stock-only, especially in regimes where realized vol stays below 25%. The all-LEAP and self-funded designs do not. Drawdowns are 75–84% on the blended versions vs. ~33% on stock-only — that’s the cost of the IRR uplift to 23–26% vs. 9.4% for stock-only.
What it demonstrates
- Real options backtest on historical chain data, not Black-Scholes synthesizing
- Honest about tail risk: when the asymmetry of leverage cuts the wrong way, it cuts very deep
- Sweep design that catches single-cell optima before they become “discoveries”
- Comparing strategies on risk-adjusted terms, not headline IRR
Stack
- Python —
numpy,pandas,matplotlibfor analysis - Historical option chain data + Monte Carlo for the synthetic regime stress tests
- ~30 distinct experiment scripts, each saving its grid + summary CSV alongside the figure