Switchback Experiments on a Simulated Marketplace
Built a two-sided rideshare marketplace, broke per-rider A/B testing on it (208% biased), and recovered the true effect with a switchback design. Worked-through bias-variance tradeoff in window length, cluster-robust SEs, and a power analysis that explains why marketplaces need 6–8 week experiments.
In plain English
Imagine Uber wants to test a small price change. The obvious experiment: flip a coin for each rider — half see the new price (treatment), half see the old price (control). After a few weeks, compare conversion rates. Whichever arm did better wins.
This is wrong on a marketplace, and it’s wrong in a way that fools almost everyone. When a treated rider books, they tie up a driver — a driver that would have served the next control rider. Treatment doesn’t just affect the treatment group; it eats into the control group’s experience. The two arms aren’t independent. The conversion gap you measure is much larger than the actual effect of the change, because control’s number is artificially depressed.
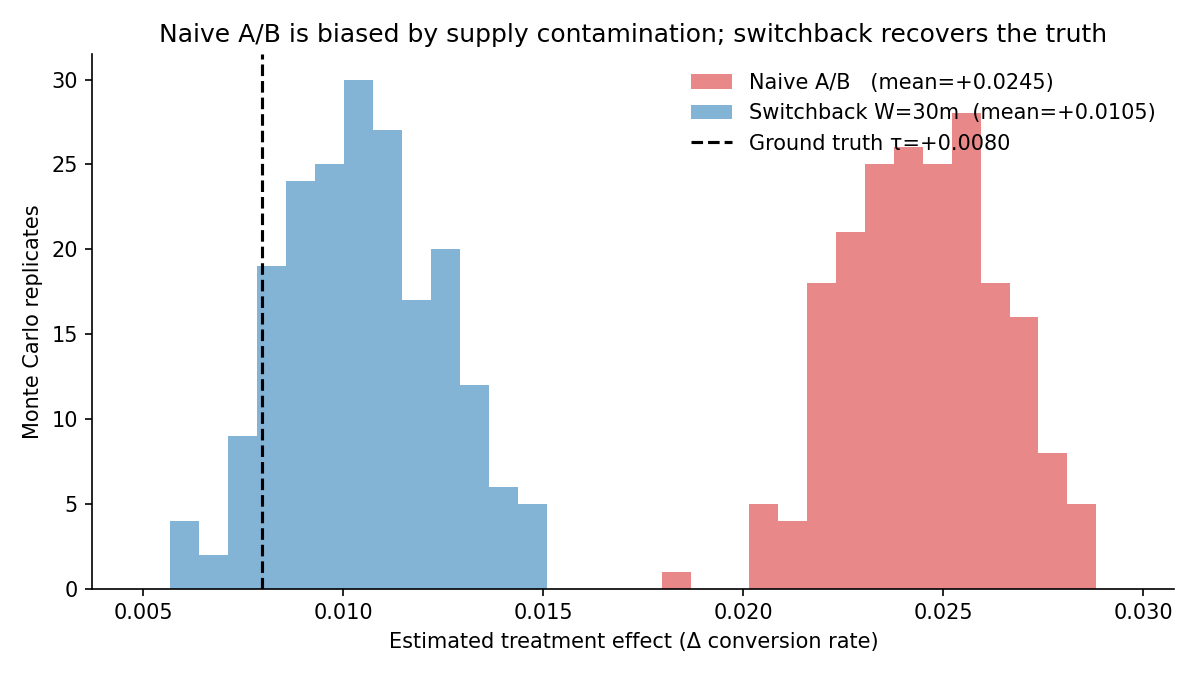
I wanted to prove this with numbers, not just describe it. So I built a simulated rideshare marketplace where I knew the true effect of the price change exactly (because I picked it), then ran both the naive coin-flip experiment and the production-standard fix — a switchback design, where the entire marketplace flips between old and new prices in time blocks. Comparing them against ground truth shows the naive design is 208% biased and switchback recovers the true effect within 11%.
Switchback experiments are how Uber, Lyft, DoorDash, Instacart, and Airbnb actually run pricing tests. They’re rarely covered in coursework. This project is the worked walkthrough.
Headline result
| Design | Mean τ̂ | Bias | % of true τ |
|---|---|---|---|
| Ground truth | +0.00796 | — | — |
| Naive A/B | +0.02449 | +0.01653 | +208% |
| Switchback (W = 30m) | +0.01051 | +0.00256 | +32% |
| Switchback (W = 120m) | +0.00881 | +0.00085 | +11% |
200 Monte Carlo replicates per design; each replicate is a 30-day simulated marketplace at λ = 5/min, N = 22 drivers, mean trip = 15 min, baseline conversion 0.30, per-rider lift τ = 0.03.
Two estimands, only one of which matters
The naive A/B isn’t merely noisy — it’s answering the wrong question. It estimates the conditional effect on a treated rider holding supply at the mixed-arm operating point (≈ 0.025), which lines up with the +0.0245 we observe. But the launch decision depends on the equilibrium effect: treatment for everyone vs. control for everyone, which is +0.008, because in an all-treatment world supply is more depleted than in the mixed world. The two estimands diverge whenever supply is finite.
Window-length bias-variance tradeoff
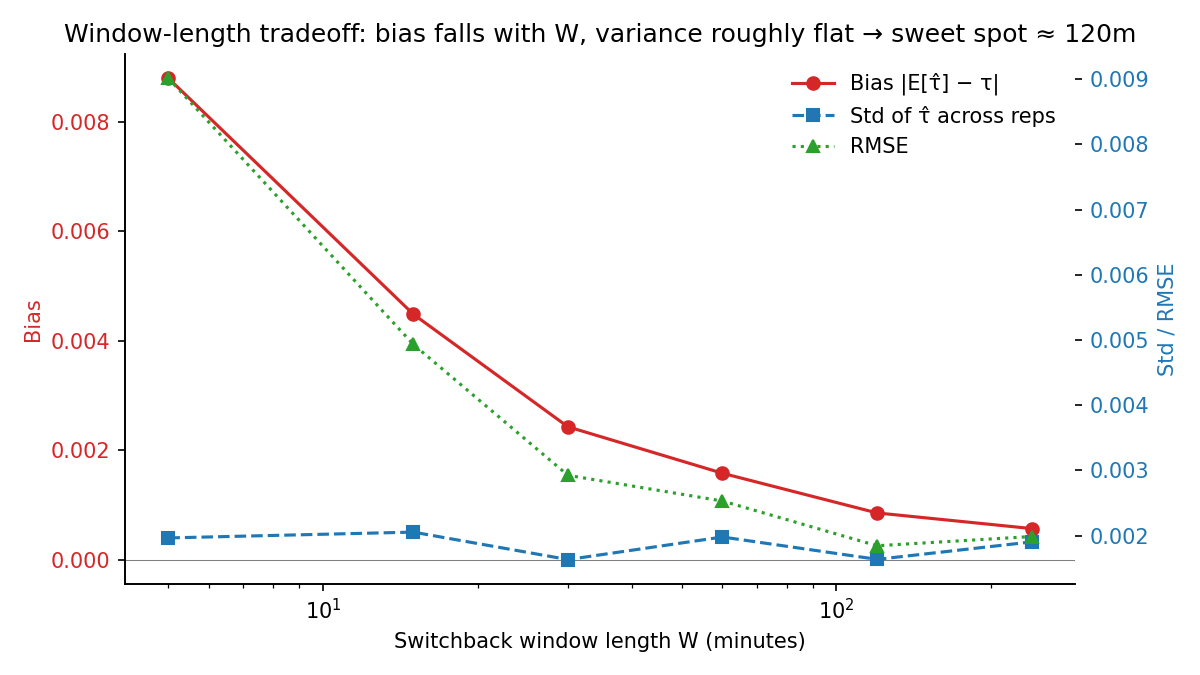
| W (min) | Bias | Std | RMSE |
|---|---|---|---|
| 5 | +0.00880 | 0.00196 | 0.00902 |
| 30 | +0.00243 | 0.00163 | 0.00292 |
| 120 | +0.00085 | 0.00164 | 0.00184 |
| 240 | +0.00057 | 0.00190 | 0.00199 |
Bias decays roughly geometrically in W; variance is roughly flat at this horizon. RMSE-optimal W ≈ 8× mean trip duration — that’s a generalizable heuristic, but the lesson is don’t import a fixed W from another company. Re-derive it at your own operating point.
Carryover diagnostic
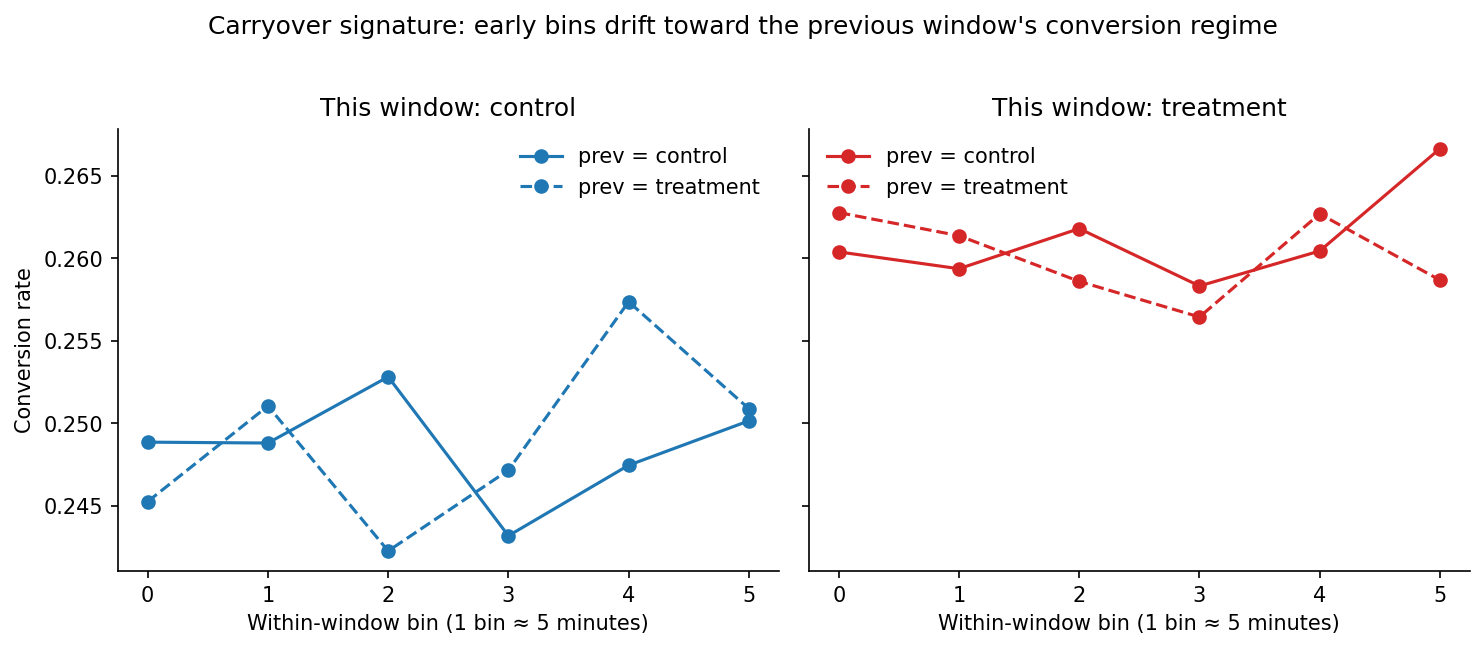
Within each window I bin riders by position from window-start and compare conversion rates across the four (this_arm, prev_arm) regimes. Control windows that follow a treatment window have depressed conversion in the early bins — drivers are still busy from the prior treatment regime. The signal is small (~0.4pp) but consistent.
Variance estimation
For W = 30 on 30 simulated days (1,440 windows, 216k riders), three SE estimators agree closely — naive per-rider, cluster-robust by window, and a 2,000-rep block bootstrap. The within-window dependence is weak enough at this λ that cluster-robust ≈ i.i.d., but I implemented all three so the diagnostic exists.
Power analysis: the practical cost of doing this honestly
Because the equilibrium τ is small (+0.008), even the right-design experiment is power-constrained. With switchback SE ≈ 0.0019 at W = 120, the 80%-power MDE at α = 0.05 is roughly 2.8 × SE ≈ 0.0053. The true effect sits just above the MDE — a 30-day switchback would detect it but with limited margin. A practitioner should plan for 6–8 weeks to shrink the SE further. Naive power calculations using the per-rider effect would tell you a few days suffices. They’d be wrong.
Sign-flip symmetry
If contamination is the real cause, flipping the sign of τ should flip the sign of the bias. It does:
| τ parameter | Equilibrium τ | Naive bias | Switchback bias |
|---|---|---|---|
| +0.030 | +0.0075 | +0.0167 | +0.0009 |
| −0.030 | −0.0114 | −0.0148 | −0.0002 |
The asymmetry in equilibrium τ is itself interesting — a price increase produces a larger-magnitude equilibrium effect than a comparable price decrease, because freed-up supply partially offsets a lift but reinforces a depression. Marketplaces amplify negative effects and damp positive ones.
Supply-scaling sanity check
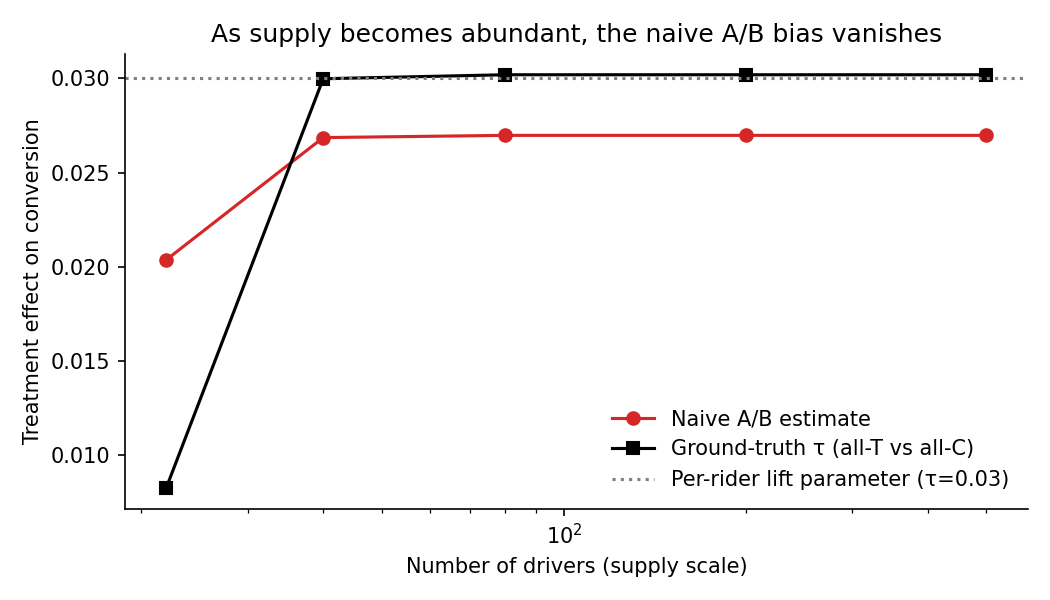
The contamination bias vanishes as N → ∞. Confirms the mechanism is supply-side, not anything else.
Stack
- Discrete-event simulator (event-driven, not time-stepped) —
numpy,scipy,statsmodels - Cluster-robust SEs by window, block bootstrap on dependent data
- Phases: zero-effect validation → main A/B vs. switchback Monte Carlo → variance + carryover → window sweep → figures
- End-to-end runtime ≈ 6 minutes single-core
What it demonstrates
- Identifying bias from interference / SUTVA violation
- Implementing a real production technique used at every marketplace company
- Bias-variance tradeoffs in experimental design under dependent data
- Reading a result honestly: the naive A/B isn’t “noisy,” it’s answering a different question
References
- Bojinov, Simchi-Levi & Shephard (2023), Design and Analysis of Switchback Experiments, Management Science.
- DoorDash engineering blog, Switchback Tests and Randomized Experimentation Under Network Effects.